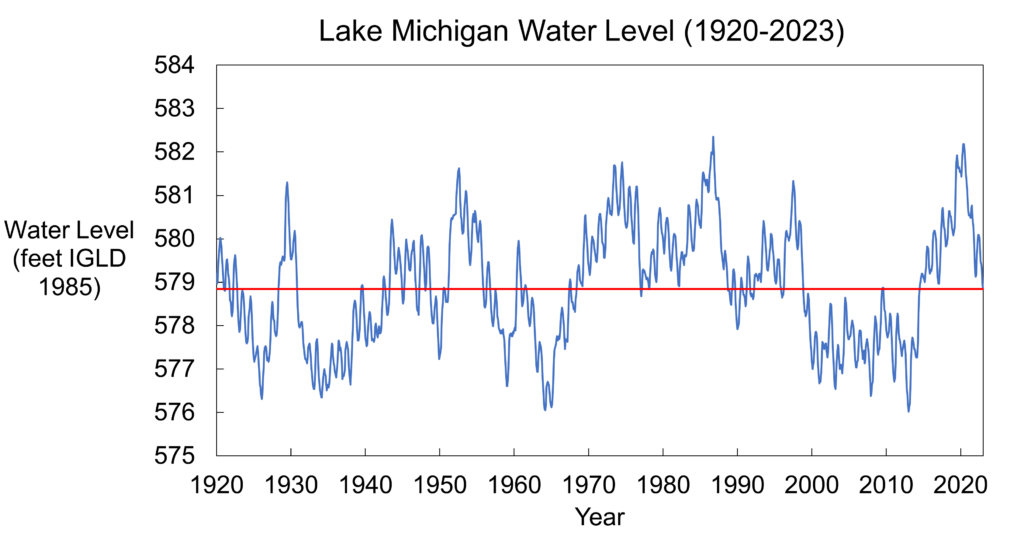
Through the late summer (August) and early fall (September and October), Lake Michigan water levels began their seasonal decline. From July to October, water levels on Lake Michigan fell approximately 7 inches. Over the past year, Lake Michigan experienced below average precipitation. Despite water levels now being approximately 37 inches below the highest monthly water level recorded in October 1986, the Lake is still about 3 inches higher than the long-term average water level for the month. Water levels are expected to drop another 2 inches by the end of November and continue their seasonal decline through the winter.
Water Levels on Lake Michigan-Huron
Here are five things to know about water levels on Lake Michigan for Fall 2023.
What are the current water levels on Lake Michigan?
The water level of Lake Michigan as of October 27, 2023, was at an elevation of 579.23 feet above sea level (from the International Great Lakes Datum). To put this level into perspective, here are some statistics for Lake Michigan relative to the period of water level records measured from 1918 to present (statistics from USACE’s Weekly Water Level Update and USACE’s Water Level Summary).
| Compared to… | Current Water Levels are… |
| One month ago | 2 inches lower |
| One year ago | 1 inch lower |
| Long-term October monthly average (1918 to 2022) | 3 inches higher |
| Record October monthly mean (set in 1986) | 37 inches lower |
What is the outlook for future water levels?
Compared to this year’s highest water levels experienced in July, Lake Michigan is down almost 7 inches. The USACE is projecting that water levels are expected to drop another 2 inches by the end of November and continue their seasonal decline through the winter (see the water level forecast issued for October 2023 below). The dropping water levels are a seasonal occurrence in the fall due to increased evaporation. While in the spring, evaporation decreases due to the increasing air temperatures while the water is cool causing water levels to peak around mid-summer. In an average year, water levels vary seasonally by about one foot from a peak in summer to a low in winter, though every year is different. You can read more about this as well as other myths about water level fluctuations in this blog.
Additionally, El Niño has returned for the first time in four years. Typically, El Niño brings above-normal temperatures and possibly drier conditions to the Great Lakes region. It’s predicted that the current drought conditions brought on by El Niño will persist for portions of Lake Michigan through January 2024. El Niño could lead to less precipitation and runoff into the Lakes this spring, which would lead to lower water levels. However, every El Niño is different and it remains to be seen what this year’s pattern will bring. Check out the NOAA Climate Prediction Center’s U.S. Winter Outlook for more information.
Over the next 6 months, Lake Michigan water levels are projected to remain above long term average water levels. The image below shows the projected water levels in green, past water levels in red, and long-term average water levels in blue. Water levels are expected to continue their seasonal decline over the next couple months.
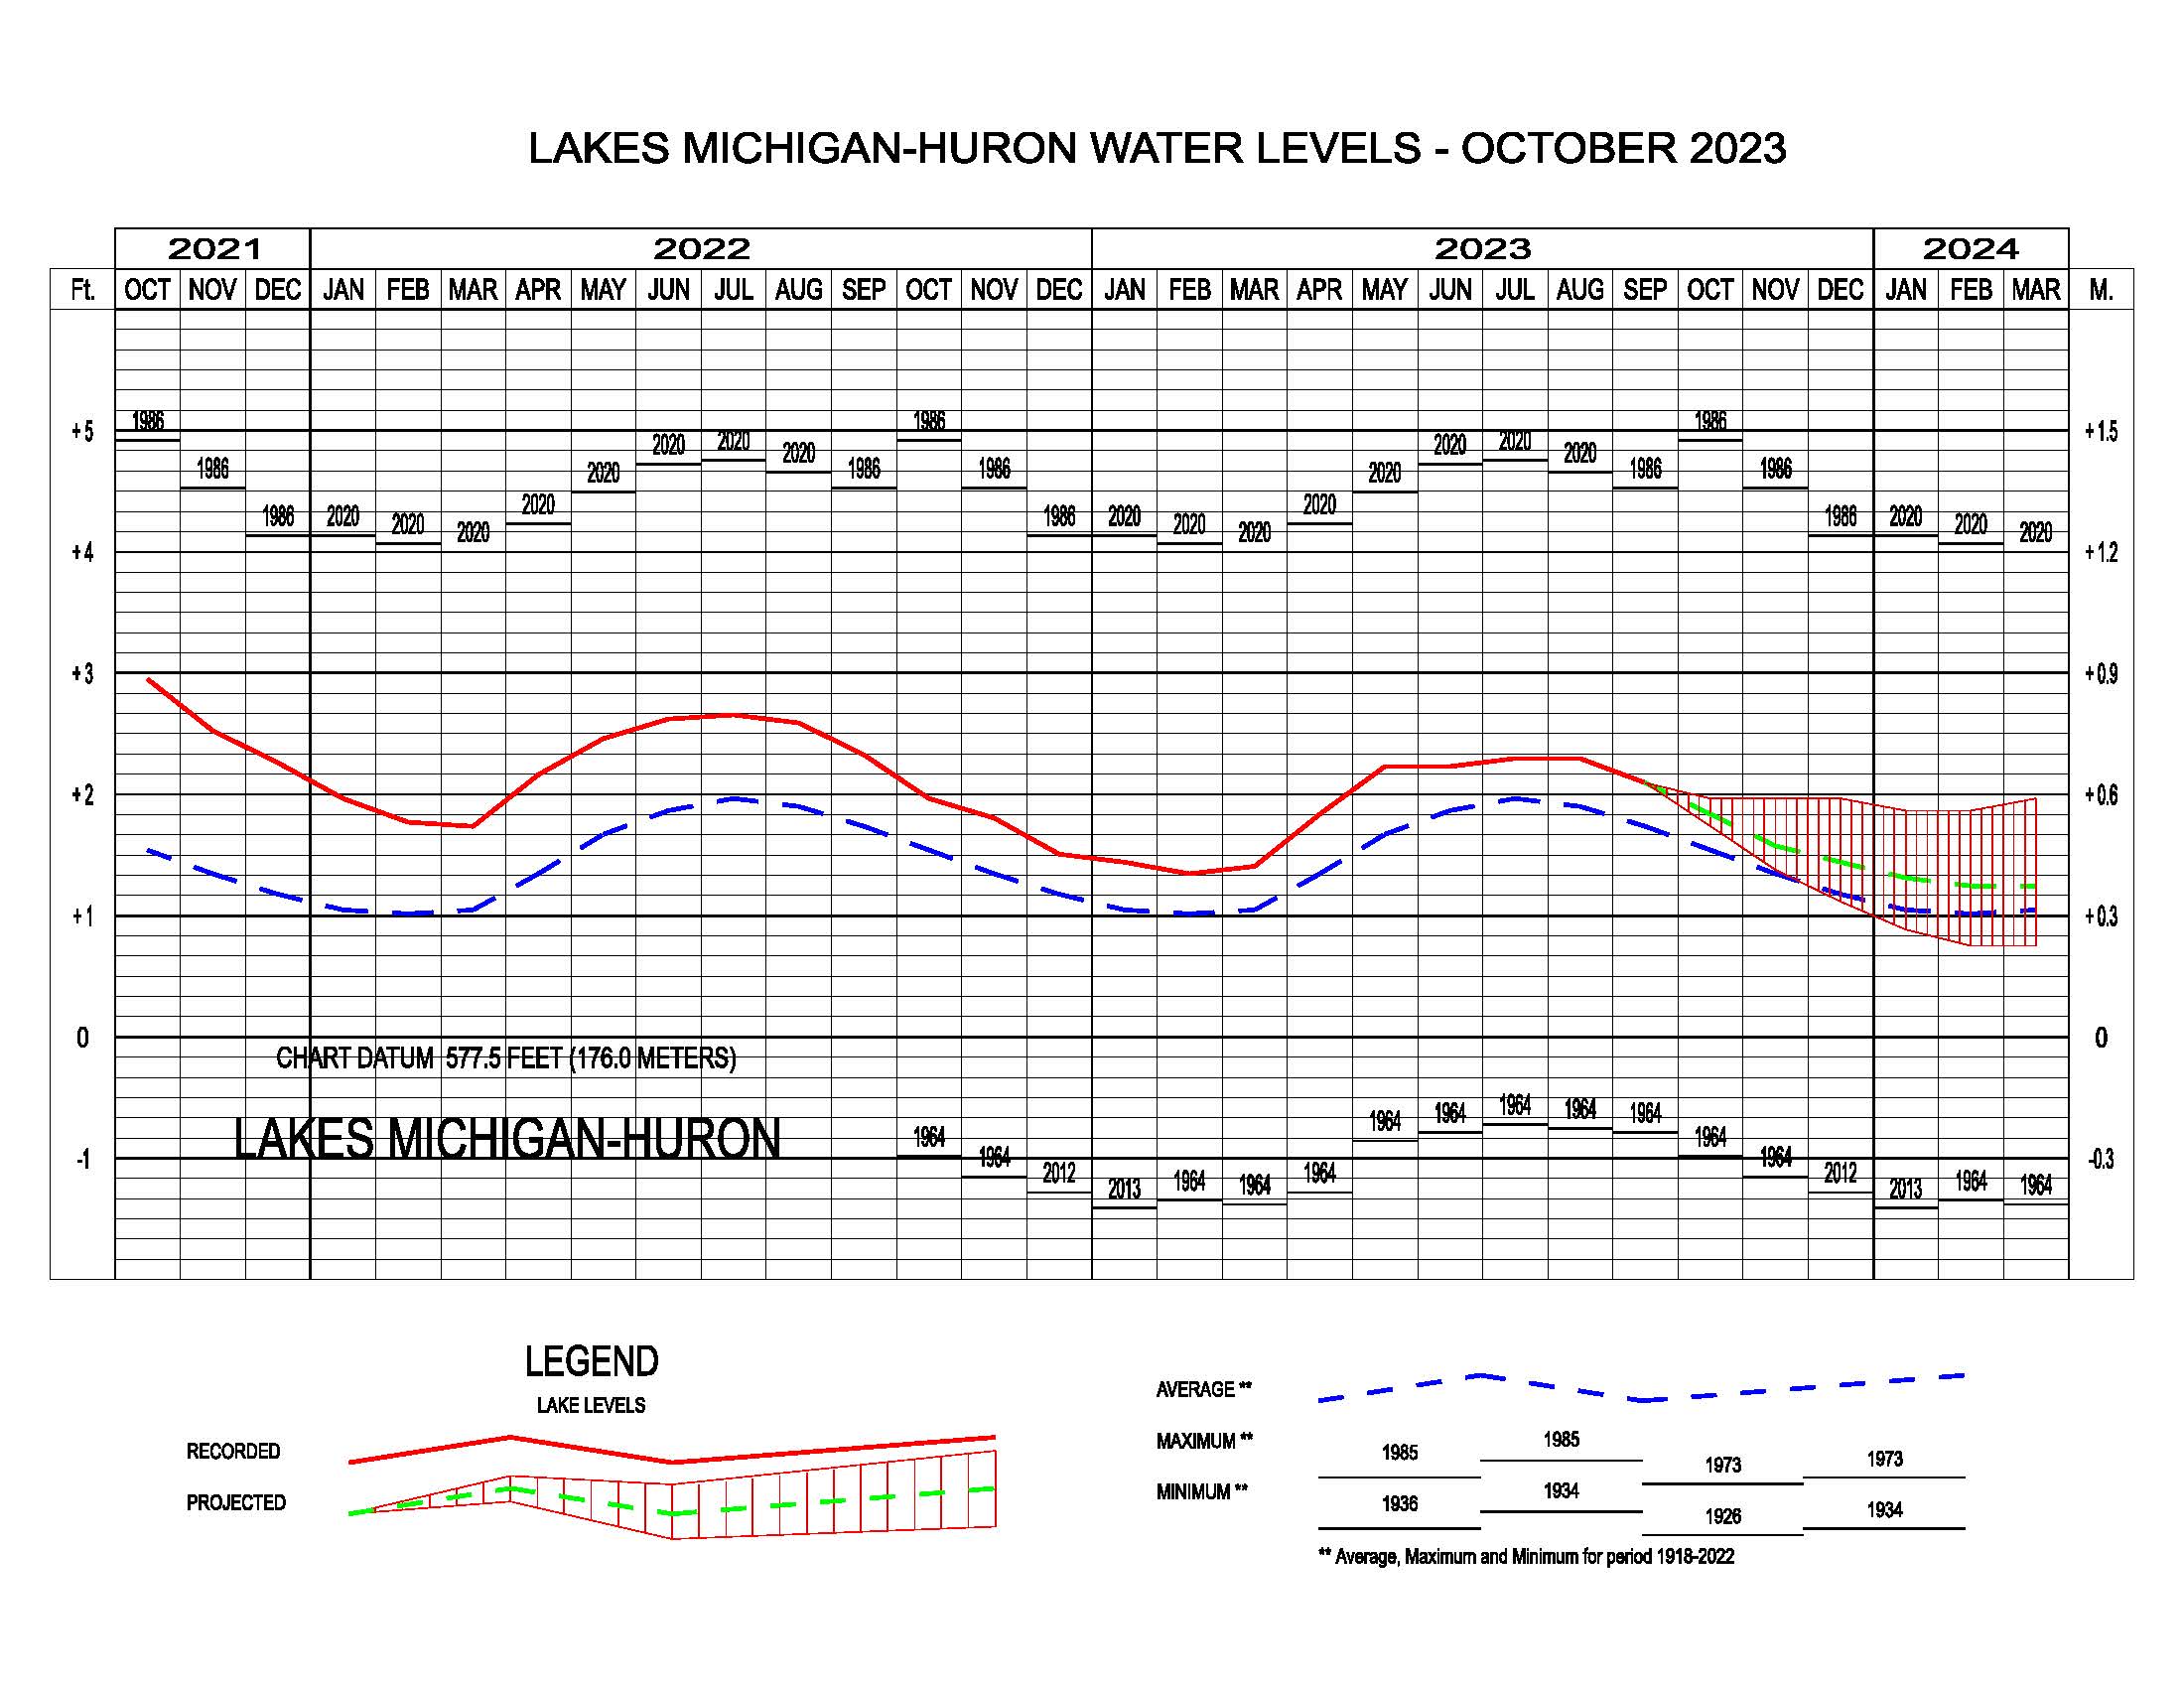
USACE six-month water level forecast for Lake Michigan-Huron retrieved for October 2023 from: https://www.lre.usace.army.mil/Missions/Great-Lakes-Information/Great-Lakes-Water-Levels/Water-Level-Forecast/
What is behind Great Lakes water level fluctuations?
The story of Great Lakes water level changes is told by Net Basin Supply. Net Basin Supply (NBS) accounts for the water going into a lake in the form of precipitation and runoff minus water leaving a lake due to evaporation of water from the lake surface.
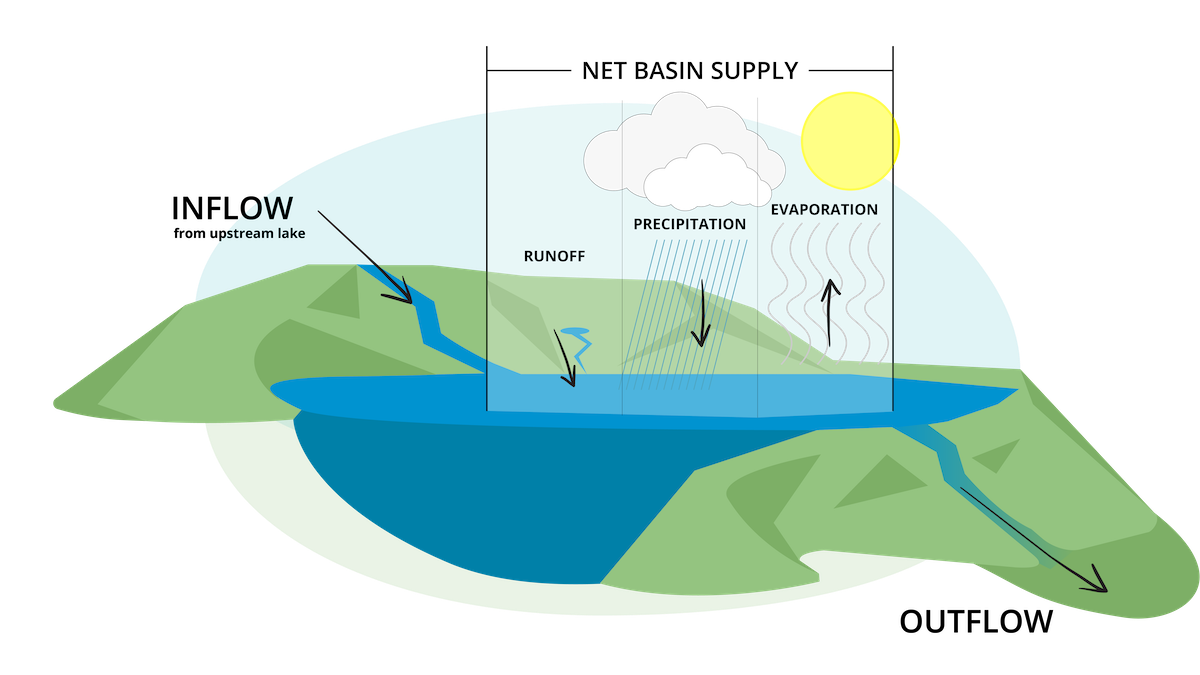
NBS represents the net influence of precipitation over the lake, runoff from a lake’s watershed into the lake, and evaporation from the lake’s surface. Image credit: National Oceanic and Atmospheric Administration
In general, when Net Basin Supply is positive, more water enters the lake than leaves, causing a rise in lake levels. When Net Basin Supply is negative, more water leaves the lake than enters, causing a drop in lake levels. (Click here for more detail).
The annual peak Net Basin Supply occurs when runoff peaks in the spring and experiences its minimum when over-lake evaporation peaks in the winter. These maximums and minimums in Net Basin Supply correspond to the seasonal water level rise and fall. (Click here for more detail).
What is making water levels go down?
Since monthly record highs in 2020, the Great Lakes water levels have been trending downwards. This trend has continued and water levels are lower than they were at the same time in 2022 due in part to below average precipitation over the past year. However, water levels still remain above the long term average. The graph below visualizes the monthly difference from the long-term average NBS for the past five years. Red bars represent below average NBS, whereas blue bars represent above average NBS.
Water level fluctuation is a process that occurs annually due to changes in net basin supply. The below average water supply over the last 12 months and increased seasonal evaporation has contributed to a negative NBS early this fall causing the water levels to drop.
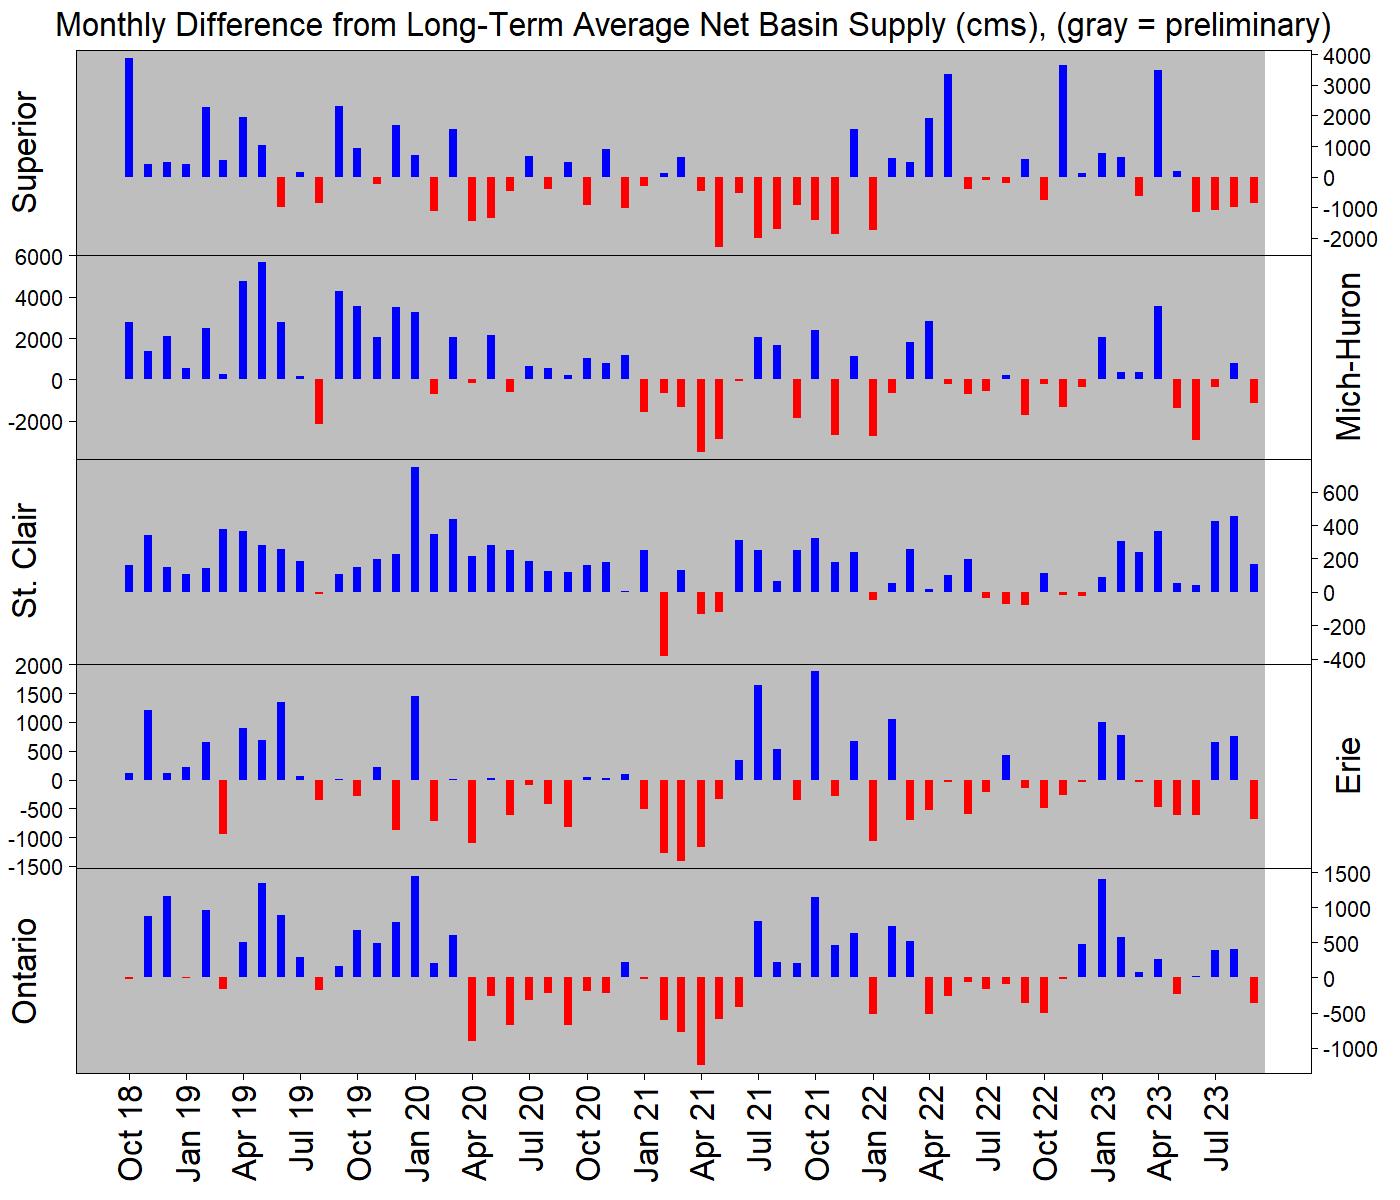
NBS relative to long term average NBS for the past 5 years. Retrieved from: https://www.lre.usace.army.mil/Missions/Great-Lakes-Information/Great-Lakes-Information-2/Basin-Conditions/
What lake conditions are typical for this season?
Fall and winter storm events are typical occurrences this time of year. In the late fall, low pressure systems from the Rocky Mountains make their way towards the Great Lakes. As these storm systems pass over the warm water (relatively speaking) of the Great Lakes, the storms can intensity. Fall and winter storms are especially notorious for strong wave events. Coupled with above average water levels, fall and winter storms can lead to erosive waves reaching higher elevations on the shore where they batter shoreline infrastructure and eat away at the base of bluffs and dunes.
Places you can find more relevant 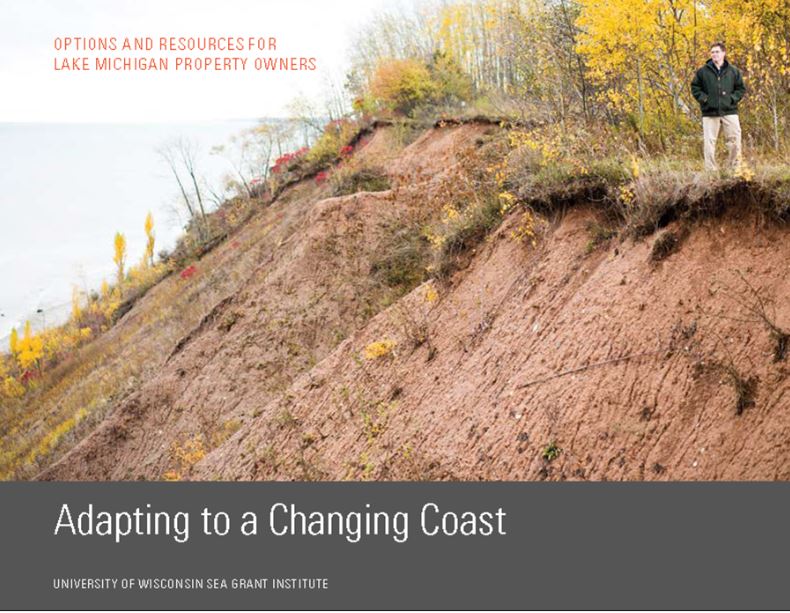 information:
- The NOAA Weather Prediction Center displays the probabilistic winter storm severity index for 6-hour time periods extending up to 7 days. The winter storm severity index displays potential winter storm impacts (it should always be used in context with official National Weather Service Forecasts).
- Our Coastal Hazards page for details about the impacts of high water levels, including erosion, flooding, and navigation issues.
- Our blog post Resources for Great Lakes Coastal Property Owners: Where do I start? has links to many resources to help
- understand coastal hazards
- weigh the risks coastal hazards pose to property
- understand options for addressing these hazards
- get started on implementing actions if necessary.
- The Great Lakes Water Budgets from the University of Michigan gives more information about what makes the lakes go up and down.
- The US Army Corps’ Great Lakes Information page has tons of details on view water level data, water level forecasts, basin conditions, outflows, etc.
- Our Resource of the Month on US Army Corps of Engineers Monthly Bulletin of Great Lakes Water Levels.