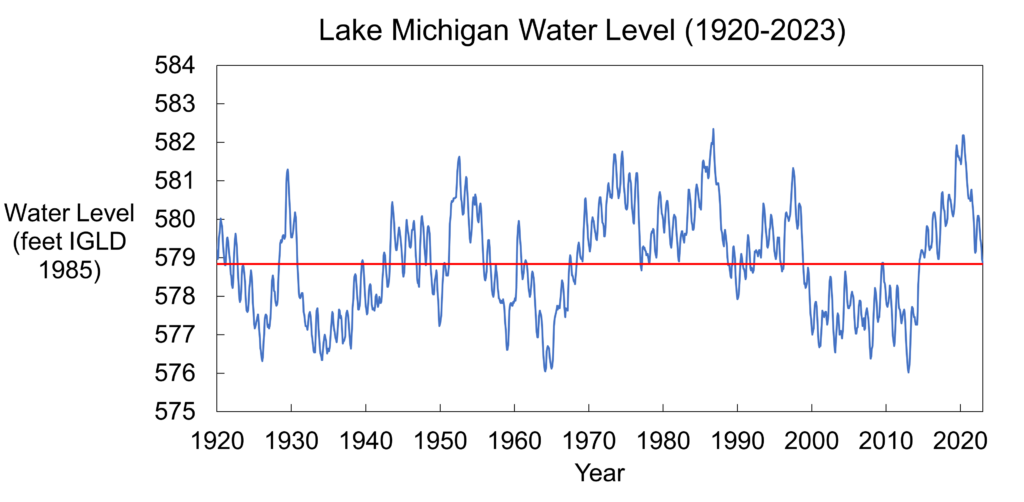
Lake Michigan water levels continued their seasonal incline, increasing 4 inches from March to April. Though Lake Michigan is now about 30 inches below the highest monthly water level recorded for April 2020, the Lake is still about 5 inches higher than the long-term average water level for the month. Water levels are expected to continue their seasonal rise over the next month.
Watch the USACE’s “On the Level” Youtube channel for monthly updates and information about the Great Lakes’ water levels and forecasts from Detroit District Hydraulics and Hydrology experts.
Water Levels on Lake Michigan-Huron
Here are five things to know about water levels on Lake Michigan for April 2023.
What are the current water levels on Lake Michigan?
The water level of Lake Michigan as of March 3, 2023, was at an elevation of 579.17 feet above sea level (from the International Great Lakes Datum). To put this level into perspective, here are some statistics for Lake Michigan relative to the period of water level records measured from 1918 to present (statistics from USACE’s Weekly Water Level Update and USACE’s Water Level Summary).
| Compared to… | Current Water Levels are… |
| One month ago | 4 inches higher |
| One year ago | 4 inches lower |
| Long-term March monthly average (1918 to 2022) | 5 inches higher |
| Record March monthly mean (set in 2020) | 30 inches lower |
What is the outlook for future water levels?
Water levels on Lake Michigan continued their seasonal incline rising by 4 inches from March to April. The USACE is projecting that water levels will rise another 4 inches by May (see the water level forecast issued for April 2023 below). The increasing water levels are a seasonal occurrence in the spring due to increased snow melt and precipitation and decreased evaporation. Decreased evaporation is caused by air temperatures increasing while the water is cool. Water levels typically increase through the spring and peak around mid-summer. In an average year, water levels vary seasonally by about one foot from a peak in summer to a low in winter, though every year is different. You can read more about this as well as other myths about water level fluctuations in this blog.
Over the next 6 months, Lake Michigan water levels are predicted to remain above long term average water levels indicated by the dashed blue line in the image below. Water levels are expected to peak in July before beginning their seasonal decline in the fall.
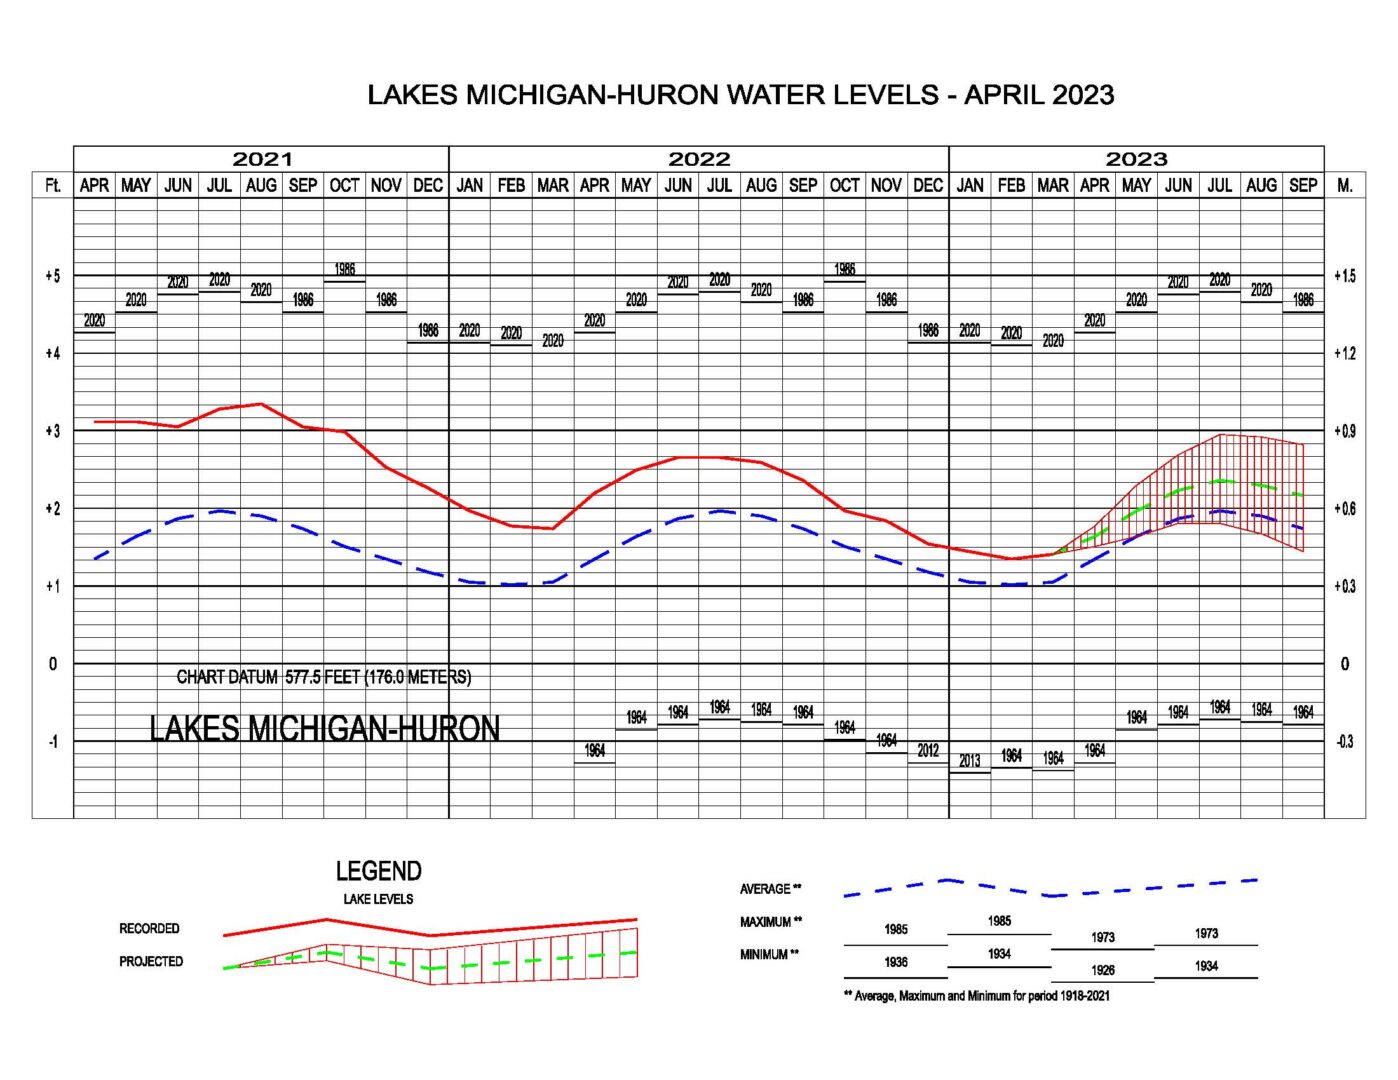
USACE six-month water level forecast for Lake Michigan-Huron retrieved for March 2023 from: https://www.lre.usace.army.mil/Missions/Great-Lakes-Information/Great-Lakes-Water-Levels/Water-Level-Forecast/
What is behind Great Lakes water level fluctuations?
The story of Great Lakes water level changes is told by Net Basin Supply. Net Basin Supply (NBS) accounts for the water going into a lake in the form of precipitation and runoff minus water leaving a lake due to evaporation of water from the lake surface.
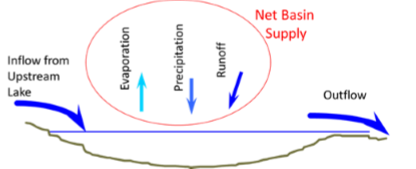
NBS represents the net influence of precipitation over the lake, runoff from a lake’s watershed into the lake, and evaporation from the lake’s surface. Image credit: US Army Corps of Engineers.
In general, when Net Basin Supply is positive, more water enters the lake than leaves, causing a rise in lake levels. When Net Basin Supply is negative, more water leaves the lake than enters, causing a drop in lake levels. (Click here for more detail).
What is making water levels go up?
Since monthly record highs in 2020, the Great Lakes water levels have been trending downwards. This trend has continued and water levels are lower than they were at the same time in 2022. However, water levels still remain above the long term average. The graph below visualizes the monthly difference from the long-term average NBS for the past five years. Red bars represent below average NBS, whereas blue bars represent above average NBS.
Water level fluctuation is a process that occurs annually due to changes in net basin supply. While precipitation has been near to below average in the Great Lakes basin for the last 12-months above average precipitation in March and continued snow and ice melt contributed to positive net basin supply causing Lake Michigan water levels to rise.
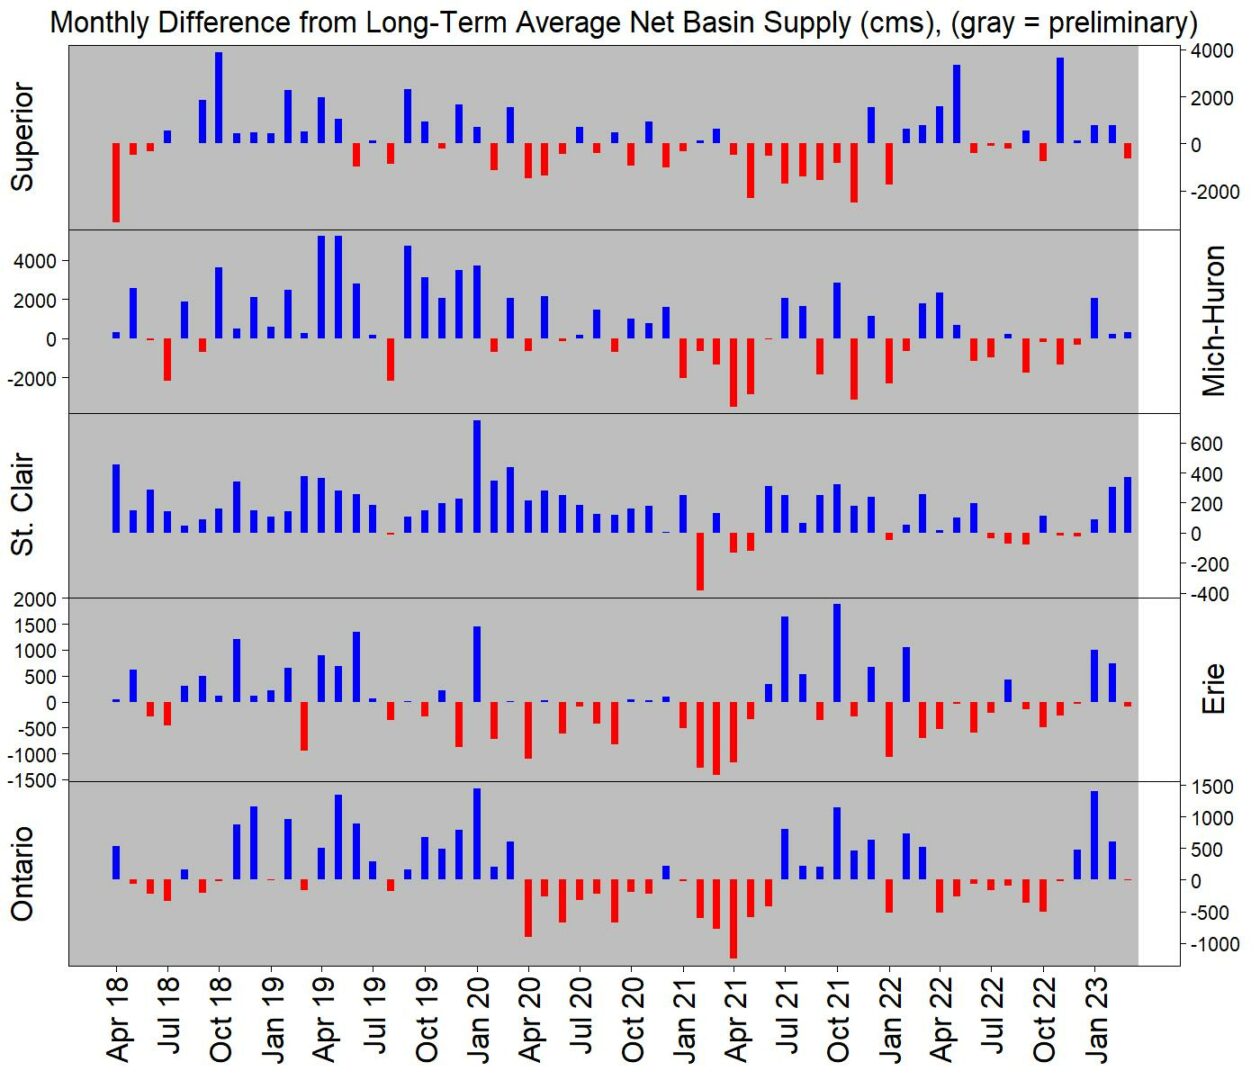
NBS relative to long term average NBS for the past 5 years. Retrieved from: https://www.lre.usace.army.mil/Missions/Great-Lakes-Information/Great-Lakes-Information-2/Basin-Conditions/
Places you can find more relevant  information:
- Our Coastal Hazards page for details about the impacts of high water levels, including erosion, flooding, and navigation issues.
- Our blog post Resources for Great Lakes Coastal Property Owners: Where do I start? has links to many resources to help
- understand coastal hazards
- weigh the risks coastal hazards pose to property
- understand options for addressing these hazards
- get started on implementing actions if necessary.
- The Great Lakes Water Budgets from the University of Michigan gives more information about what makes the lakes go up and down.
- The US Army Corps’ Great Lakes Information page has tons of details on view water level data, water level forecasts, basin conditions, outflows, etc.
- Our Resource of the Month on US Army Corps of Engineers Monthly Bulletin of Great Lakes Water Levels.