An interactive tool for users to explore detailed weather information.
National Weather Service Great Lakes Portal
Overview
The National Weather Service Great Lakes Portal is an interactive tool for users to explore detailed weather information. This tool is hosted by the National Weather Service (NWS), a subset of the National Oceanic and Atmospheric Administration (NOAA). NWS is “an organization that relies heavily on science, partnerships, and ties to local communities to successfully provide weather, water, and climate data, forecasts and warnings for the protection of life and property and the enhancement of the national economy” (weather.gov). Most of the data services mentioned, weather, water, climate data, forecasts, and warnings lie within this page. The landing page of the Great Lakes Portal allows you to see current and forecasted weather and hourly forecasts for up to 6 days in the Great Lakes region. This weather specifically includes wave height, wind speed, and wind gusts. It would be most useful for mariners or those looking for beach or water-fairing activities. Additionally, linked to this page, are other tools that may be of interest for further research including different products, partners, miscellaneous items, seasonal tools, and forecast offices.
Audience
This tool is primarily for mariners and those taking out boats. It may also be useful for those who need to rely on wind direction and strength. The information could potentially be important for researchers, decision-makers, and organizations with a focus on areas around the Great Lakes. This platform also shows and may predict extreme weather events which would be beneficial for the public to know as well.
Decision Support
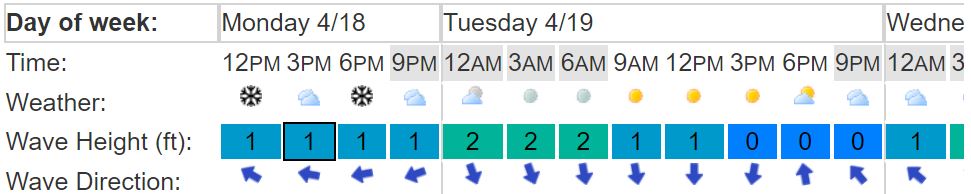
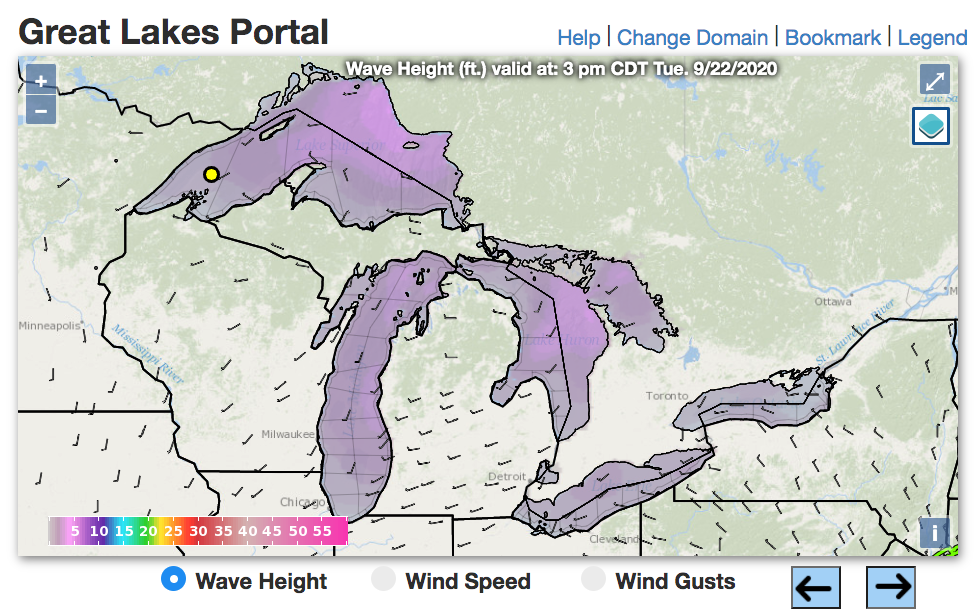
This tool provides information about wave height, wind speed, and wind gusts on the Great Lakes. It also has hourly predictions for a 6-day forecast. In order to look more closely at a specific location, the user can click on a location on the map to denote the forecast point. This point then becomes the basis for the forecasting tables and plots below the map. These tables and plots show more detailed weather data of the forecast location. Zooming into the map, the user is able to see more detail, however, this depends upon which layers are selected and the level detail provided. Layers include different hazards and risks (active, beach, swim), lightning density, wind direction, ship observations, radar, water levels, among others, all of which can be selected and deselected by the user.