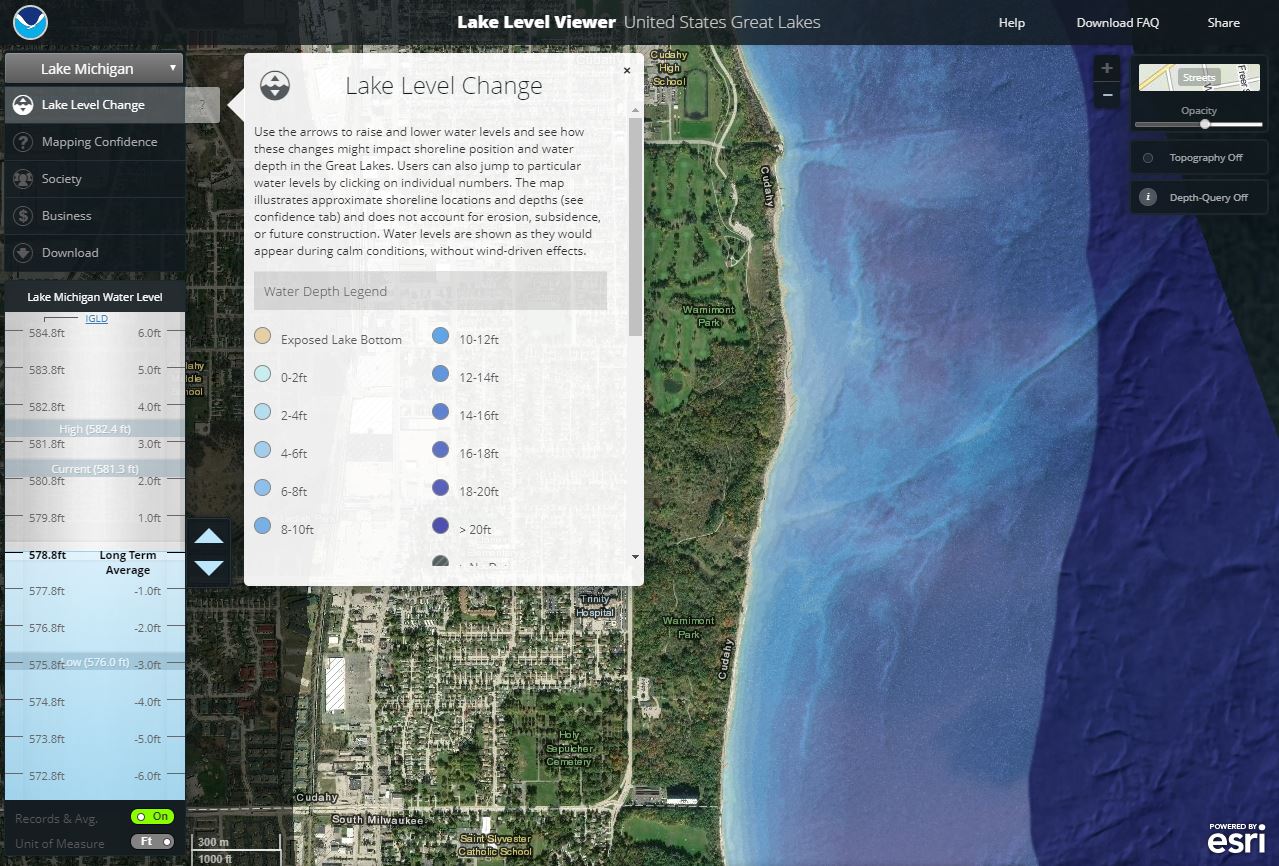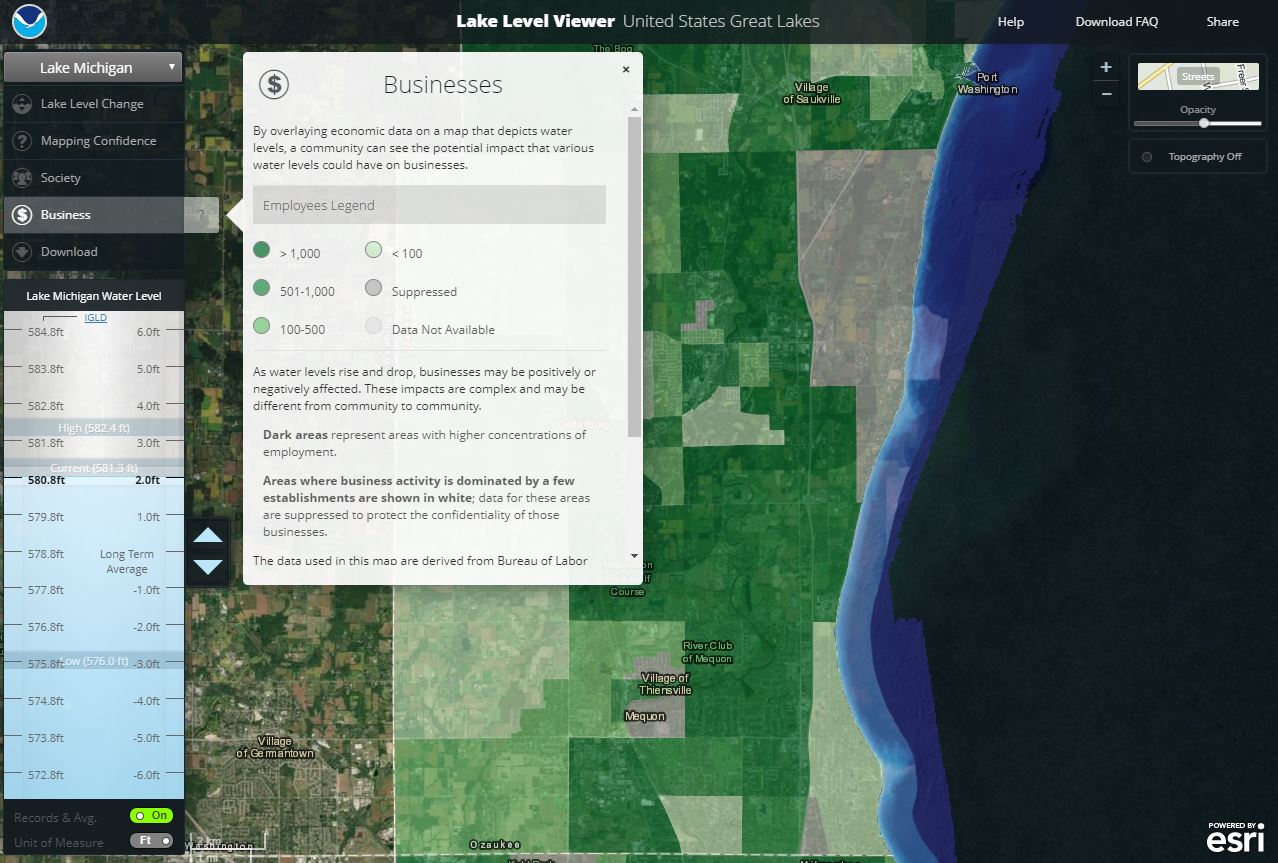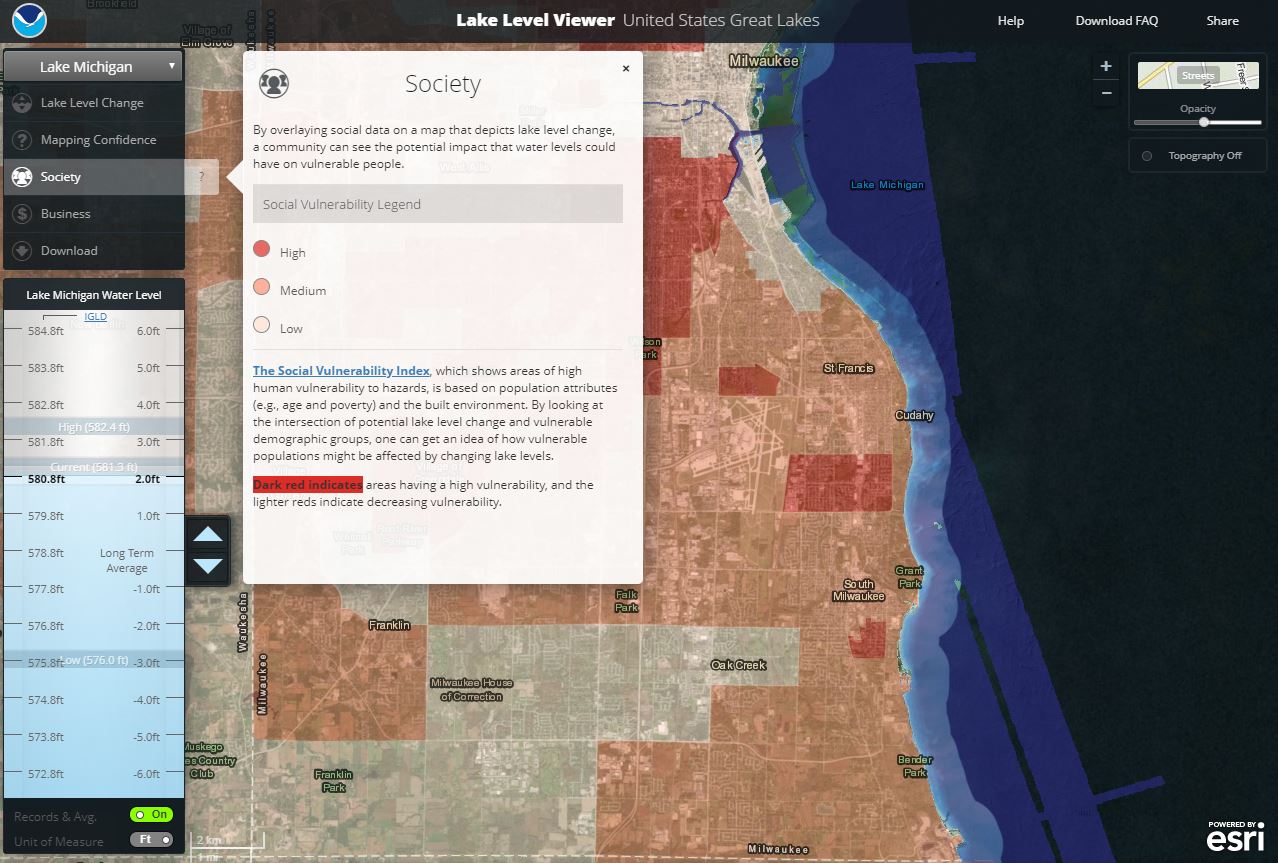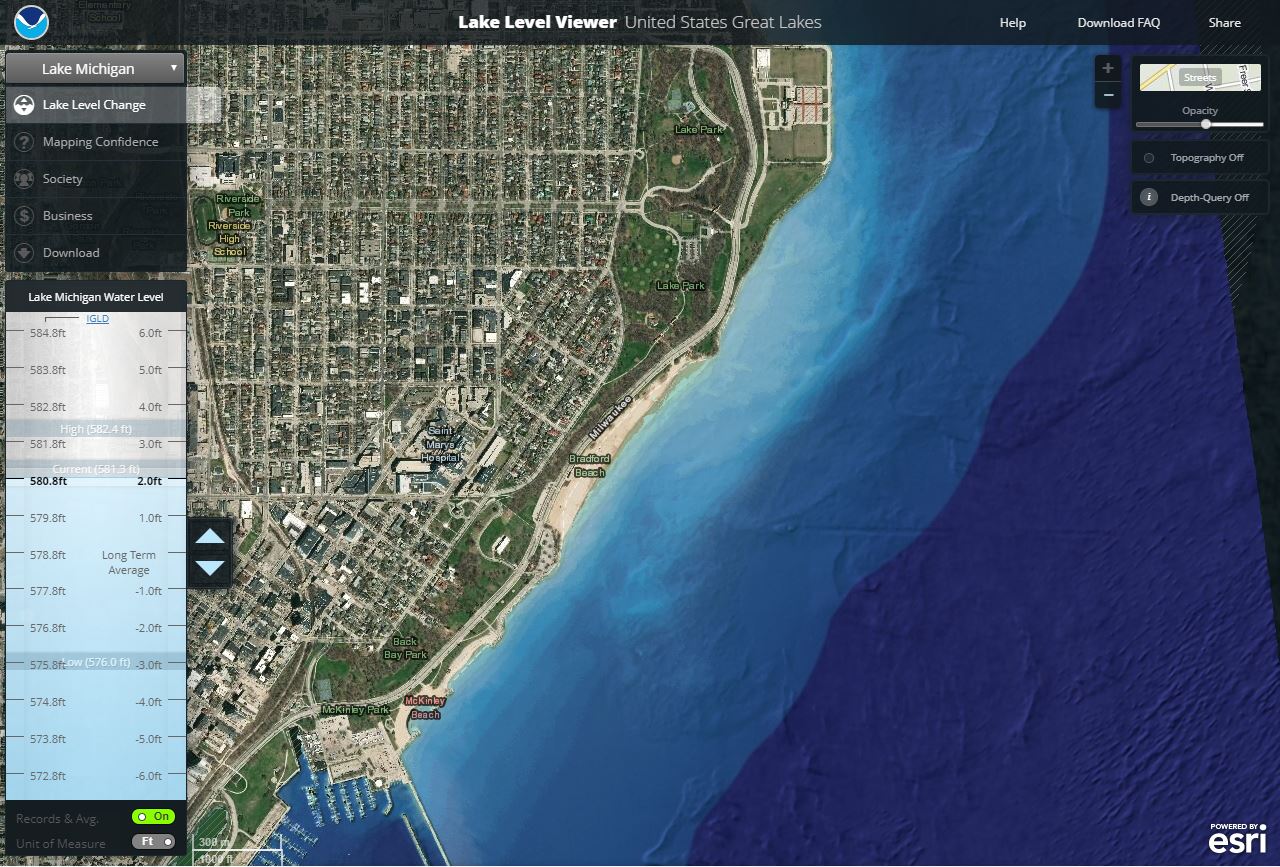
Interactive map used to help users visualize potential Great Lakes water level changes and impacts.
Lake Level Viewer
Overview
The Lake Level Viewer is a web-based, interactive map used to help users visualize potential Great Lakes water level changes and impacts. The map allows users to pinpoint areas of concern for flooding and heavy erosion. In addition, the tool shows potential flooding projected on pictures of various local landmarks around the Great Lakes. The Lake Level Viewer covers more than 6,858 square miles, including all of Lakes Superior, Michigan, Huron, St. Clair, Erie, and Ontario. This tool was developed by the National Oceanic and Atmospheric Administration and is available online to use for free.
Audience
The Lake Level Viewer is available to local officials as a decision support tool. However, Great Lakes citizens are encouraged to use it and consider what steps they might need to take to prepare for the potential impacts of the changing lake levels.
Decision Support
The Lake Level Viewer web-based map helps officials determine where their community is most vulnerable. The tool also shows potential flooding impacts projected on images of local landmarks. These functions provide users with background information to support proactive management decisions and are helpful when communicating risk and the need to take preventive actions to constituents. It is important to note that this is a screening-level tool and should not be used for detailed decision-making. All the data in the viewer, including elevation data, are downloadable for further analysis.
