“A multi-agency gateway to long-term, basin-scale hydrological and climatological data for the Laurentian Great Lakes”
Great Lakes Water Level Dashboard
Overview
The Great Lakes Water Level Dashboard is a free, online, interactive website that portrays monthly water level information for all the Great Lakes. It is sponsored by the Great Lakes Restoration Initiative (GLRI), the Cooperative Institute for Great Lakes Research (CIGLR), and the Great Lakes Environmental Research Laboratory (GLERL), part of the National Oceanic and Atmospheric Administration (NOAA). Lakes levels are monitored through a binational partnership between the U.S. and Canada.
There are 86 monitoring stations on the lakes collecting water level averages every 6 minutes. The dashboard allows the user to view water levels, oscillation/pattern indices, percentages, hydrological input/output, speeds, temperatures, and flow rates. This data can also be viewed at different time scales – at the bottom of the page, there is a time scale slider that allows the user to view the metrics from as early as 1860 to 2050 depending on what data is available or predicted.
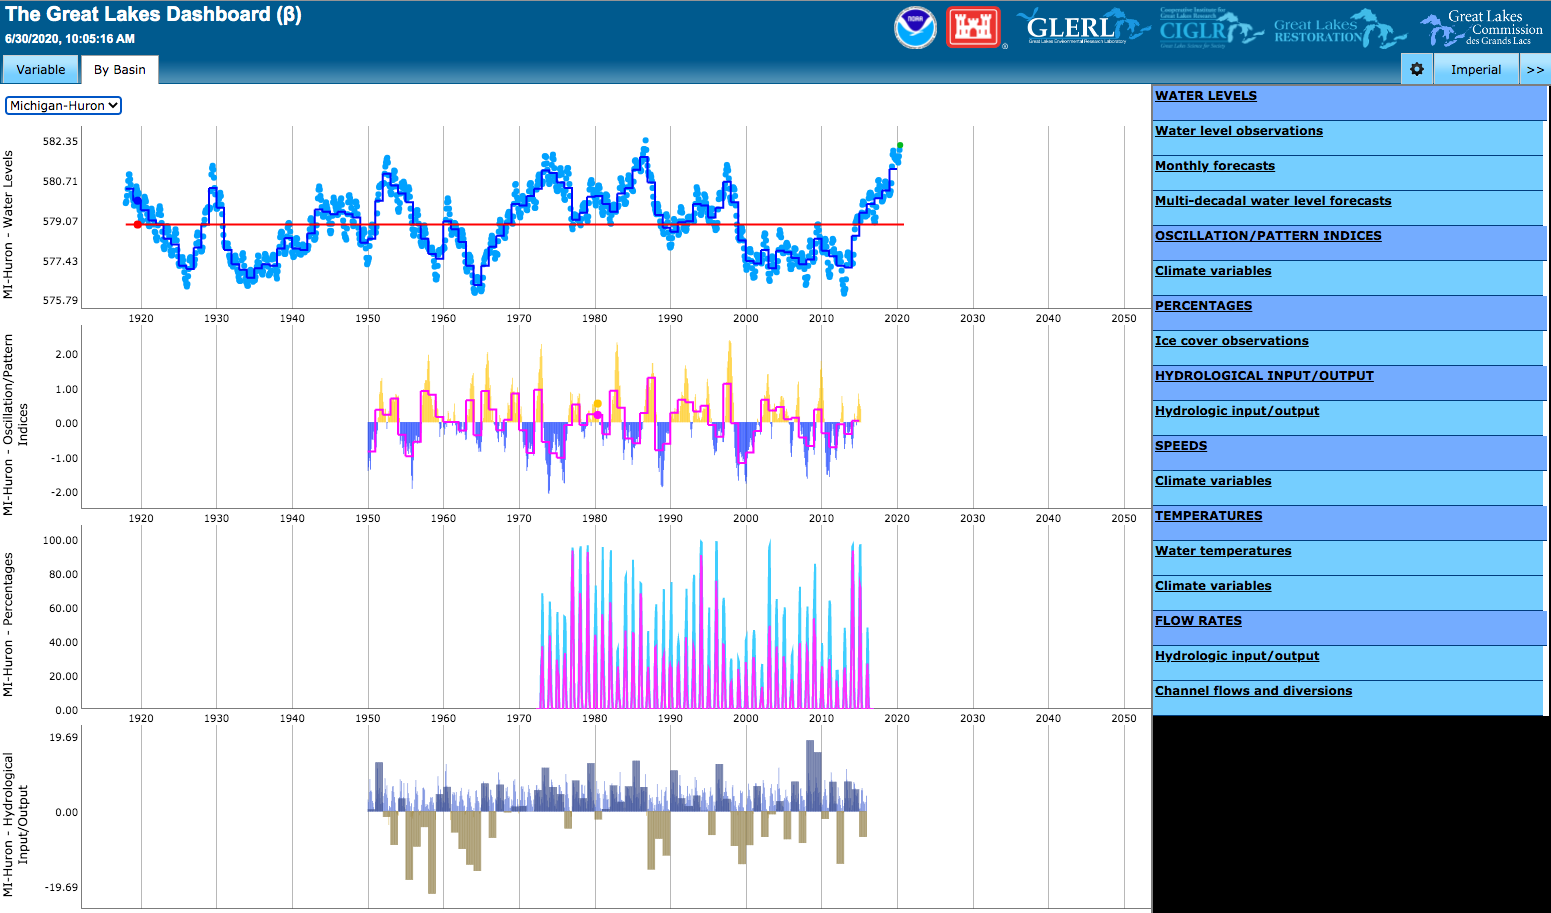
Image of Michigan-Huron water data from the Great Lakes Dashboard.
Zooming in on the water levels for Lakes Michigan-Huron, you can see that water levels in these lakes have fluctuated quite frequently between 1915 and 2020, going through periods of increases and decreases. Recently, since about 2014, water levels have been rising. The right-most dot (green) portrays the current water level. As of July 3, 2020, Lake Michigan water levels are at 582.22 ft. This is the 6th month in a row where a water level record has been set for Lake Michigan.
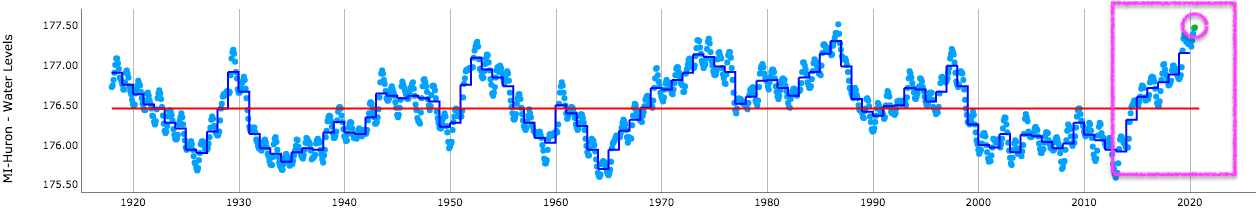
Water level data for Lakes Michigan-Huron from 1915 – 2020.
Audience
The Great Lakes Water Level Dashboard is designed to support and be used by anyone interested in better understanding the long-term variations of water levels on the Great Lakes. The Dashboard provides useful visualizations of long-term data for decision makers, emergency managers, coastal engineers and professionals, planners, and engaged property owners.
Decision support
This dashboard is representative of general fluctuations in the Great Lakes water levels and can be used to study and understand the trends of lake levels. Users can compare water level information across each of the Great Lakes, or they can look specifically at one Lake at a time. A panel on the side of the Dashboard allows the user to add or remove data sets to tailor the information they are reviewing to their needs. This data is also updated frequently so users are able to download the most up to date data that is portrayed on the website. It is noted on the website that one limitation of this data is that it is not intended for navigational use. General data inquires can be emailed to oar.glerl.data@noaa.gov.
Great Lakes Water Level Dashboard