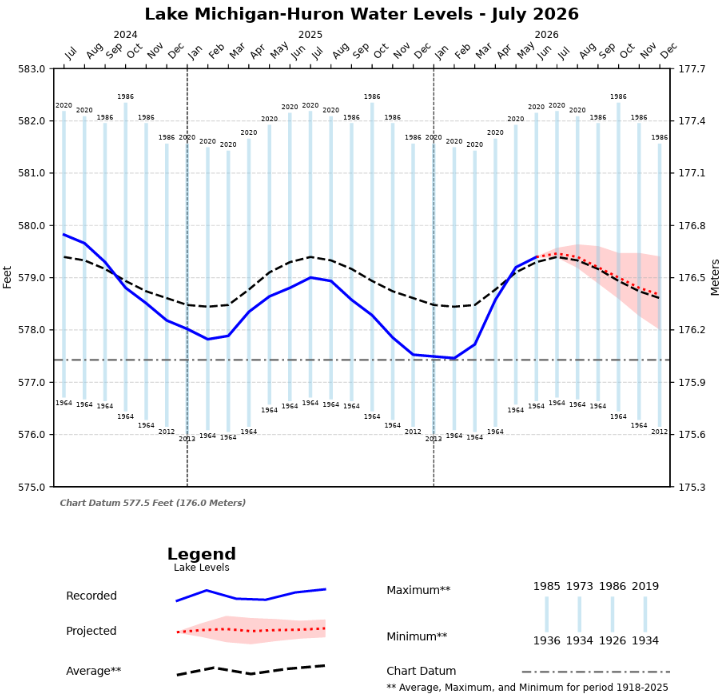
Lake Michigan water levels peaked in July and decreased 1 inch by the end of the month. Lake Michigan is now 1 inch above the long-term average water level for July. Water levels are forecast continue their seasonal decline and decrease another 2 inches in August.
Water Levels on Lake Michigan-Huron
Here are 5 things to know about water levels on Lake Michigan for July 2026.
What are the current water levels on Lake Michigan?
The water level of Lake Michigan as of July 31, 2026 was at an elevation of 579.46 feet above sea level (from the International Great Lakes Datum). To put this level into perspective, here are some statistics for Lake Michigan relative to the period of water level records measured from 1918 to present (statistics from USACE’s Weekly Water Level Update).
| Compared to… | Current Water Levels are… |
| One month ago | 1 inch lower |
| One year ago | 6 inches higher |
| Long-term July monthly average (1918 to present) | 1 inch higher |
| Record July monthly mean (set in 2020) | 33 inches lower |
What is the outlook for future water levels?
Water levels peaked in July and then began their seasonal decline. The USACE 6-month forecast of Great Lakes Water levels shows water levels are expected to continue their seasonal decline through late-summer and fall, with water levels staying near the long-term average (see the water level forecast issued for July 2026 below).
USACE six-month water level forecast for Lake Michigan-Huron retrieved for July 2026 from: https://water.usace.army.mil/office/lre/docs/mboglwl/MBOGLWL-mich_hrn.pdf
What are current and predicted climate conditions like?
According to NOAA’s Climate Prediction Center, El Niño conditions continue and will strengthen through the end of the year, with a 97% chance they will persist through early spring 2027. Across Wisconsin, there are equal chances for above or below normal temperatures in August. Precipitation forecasts for August show an equal chance for above normal or below normal precipitation in Wisconsin (see precipitation outlook map from NOAA Climate.gov below). Check out the NOAA Climate Prediction Center for a full U.S. climate outlook.
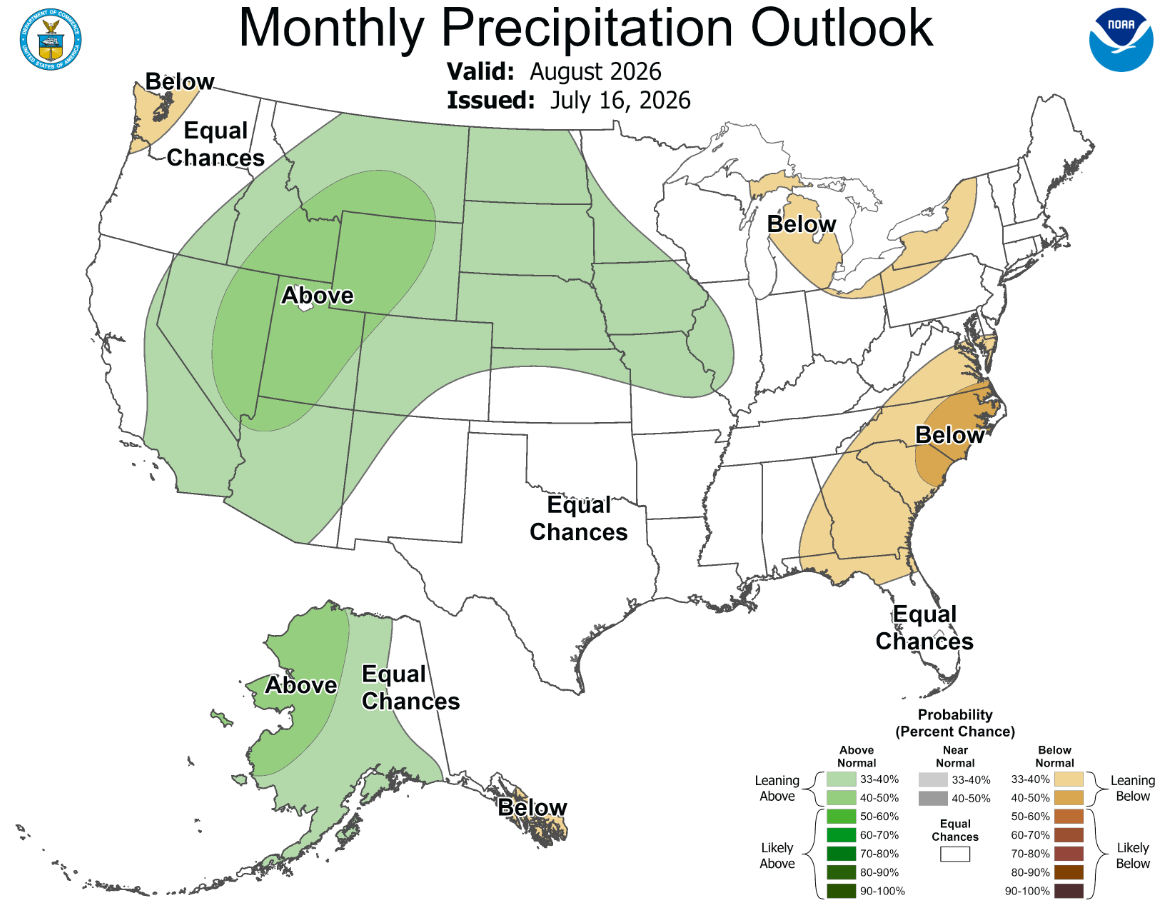
The U.S. precipitation outlook for August 2026. Map by NOAA Climate.gov, based on data from the Climate Prediction Center. From: https://www.cpc.ncep.noaa.gov/
What is behind Great Lakes water level fluctuations?
The story of Great Lakes water level changes is told by Net Basin Supply. Net Basin Supply (NBS) accounts for the water going into a lake in the form of precipitation and runoff minus water leaving a lake due to evaporation of water from the lake surface.
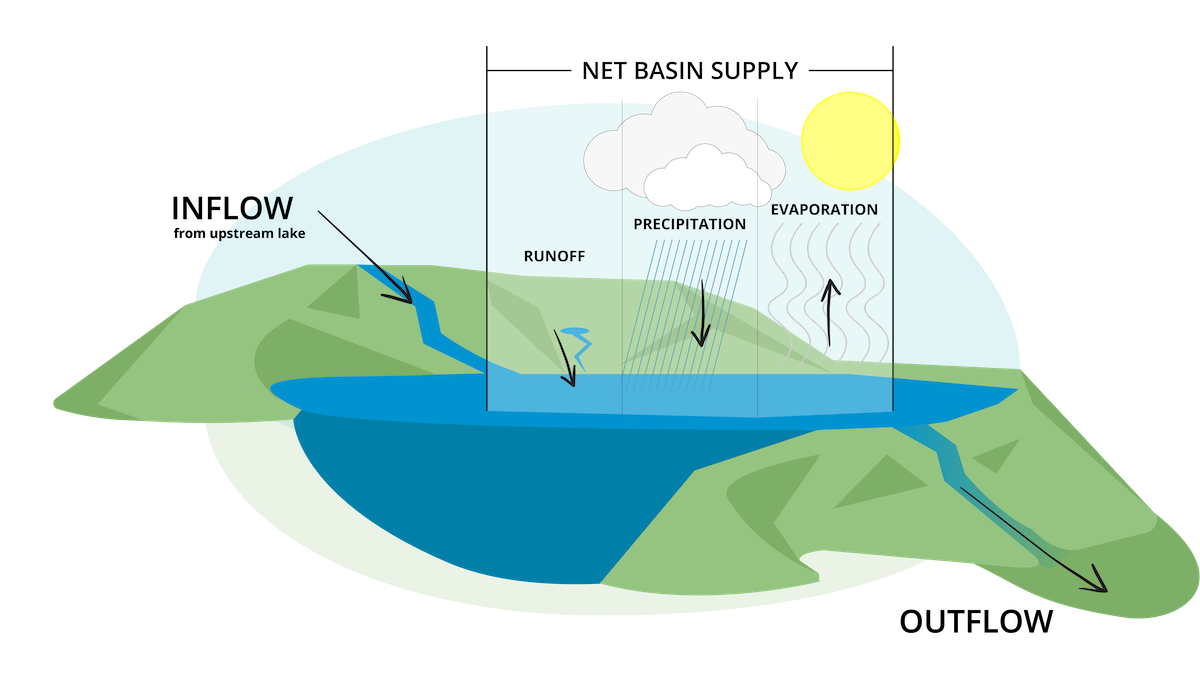
NBS represents the net influence of precipitation over the lake, runoff from a lake’s watershed into the lake, and evaporation from the lake’s surface. Image credit: National Oceanic and Atmospheric Administration
In general, when Net Basin Supply is positive, more water enters the lake than leaves, causing a rise in lake levels. When Net Basin Supply is negative, more water leaves the lake than enters, causing a drop in lake levels.
The annual peak Net Basin Supply occurs when runoff peaks in the spring and experiences its minimum when over-lake evaporation peaks in the winter. These maximums and minimums in Net Basin Supply correspond to the seasonal water level rise and fall.
Evaporation takes place when the Lake’s surface water temperature is warmer than the air temperature. Evaporation increases in the fall and winter as the difference between air temperature and water temperature increases. In June, Lake Michigan water supplies were average and water outflows were below average.
How are water levels trending?
In July, the seasonal, spring water level rise ended and the fall water level decrease began. This month, water levels on Lake Michigan were 6 inches higher than they were at the same time in 2025 and 1 inch higher than the long-term July monthly average. Water levels are expected to remain about average for the next six months.
The graph below visualizes the monthly NBS in recent years compared to the monthly mean, maximum, and minimum for each lake basin. Red diamonds represent below average NBS, whereas blue diamonds represent above average NBS.
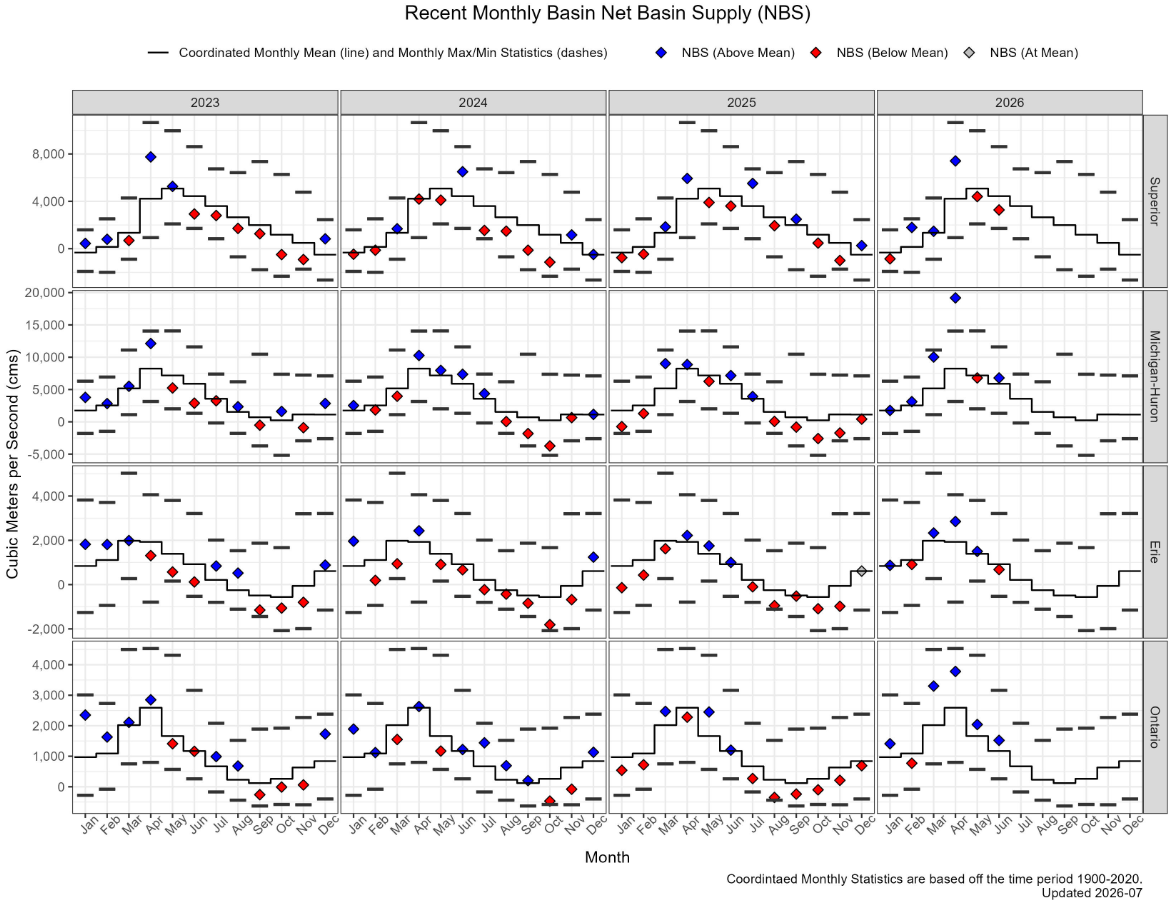
Monthly NBS in recent years compared to the monthly mean, maximum, and minimum for each lake basin. Retrieved from: https://water.usace.army.mil/office/lre/basinconditions/basinConditions
Water level fluctuation is a process that occurs annually due to changes in net basin supply. For Lake Michigan, every month in 2026 except for May had above average net basin supply, contributing to the seasonal water level increase.
More Resources & Relevant Information:
- In this Adapting to A Changing Coast PBS Special, Dr. Adam Bechle explains how fluctuations in rainfall, runoff, and evaporation cause the Great Lakes’ water levels and coastlines to vary.
- NOAA’s Climate.gov site hosts climate data and information to help you understand climate processes and make decisions on how to manage climate-related risks and opportunities.
- U.S. Climate outlook for August 2026
- Great Lakes Chapter of the Climate Resilience Toolkit
- Our Coastal Hazards page for details about the impacts of high water levels, including erosion, flooding, and navigation issues.
- Our Policy, Planning, and Risk Reduction Strategies page has tools and resources to help local governments identify local resilience opportunities.